Fri May 01 — 2 trade(s) — +$24
Open PDF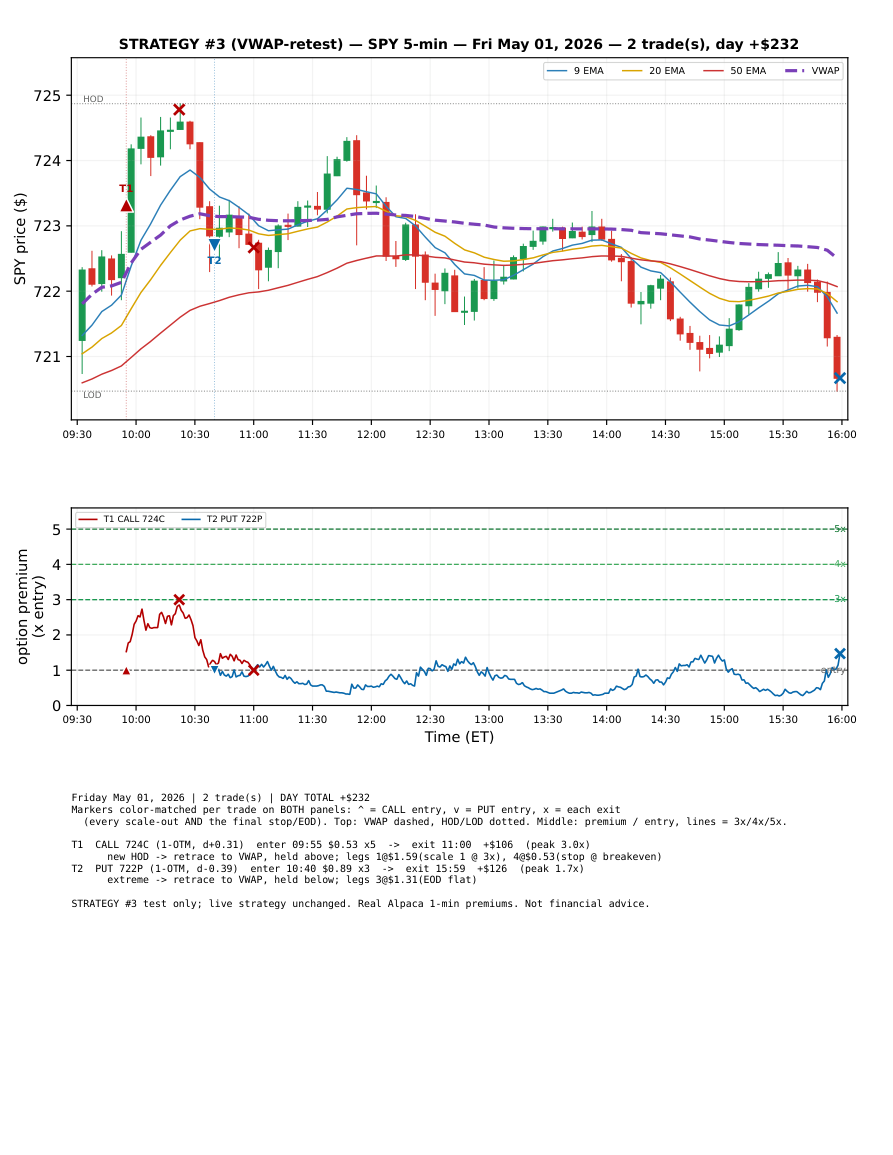
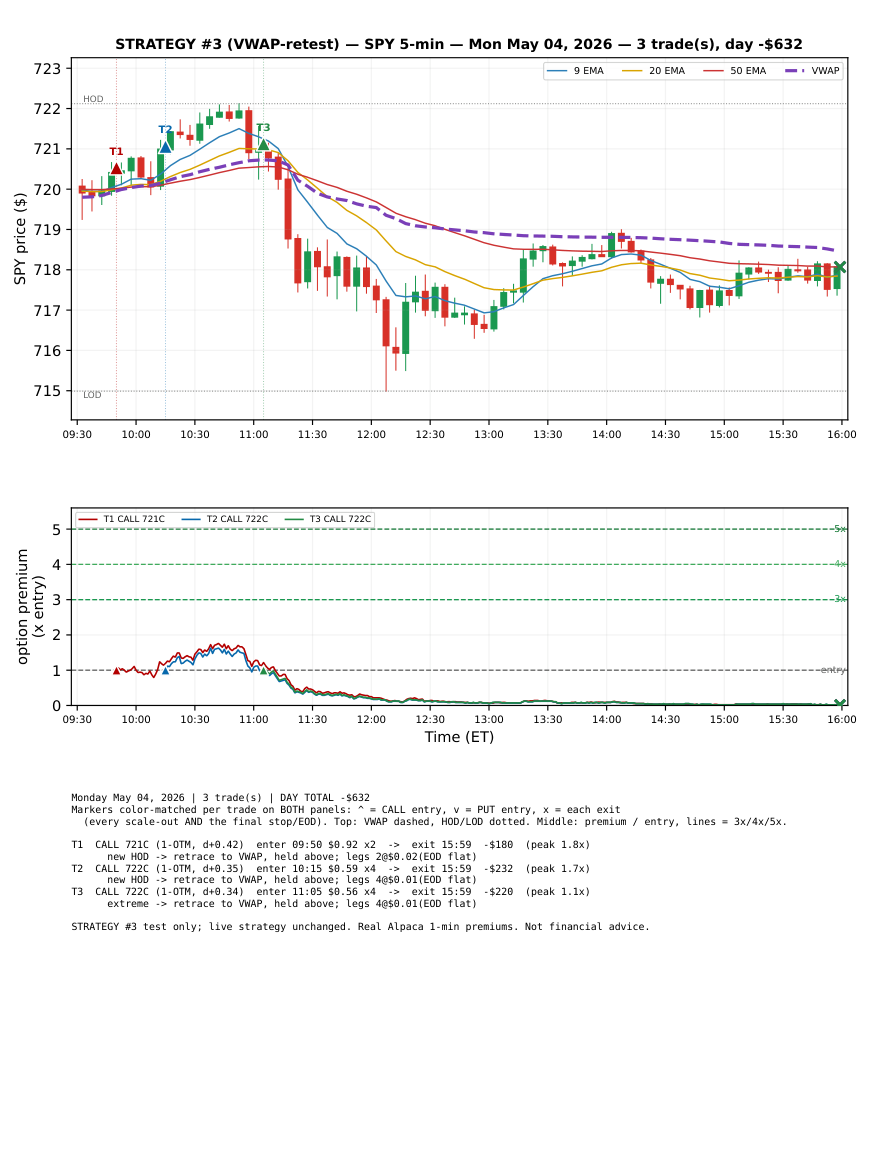
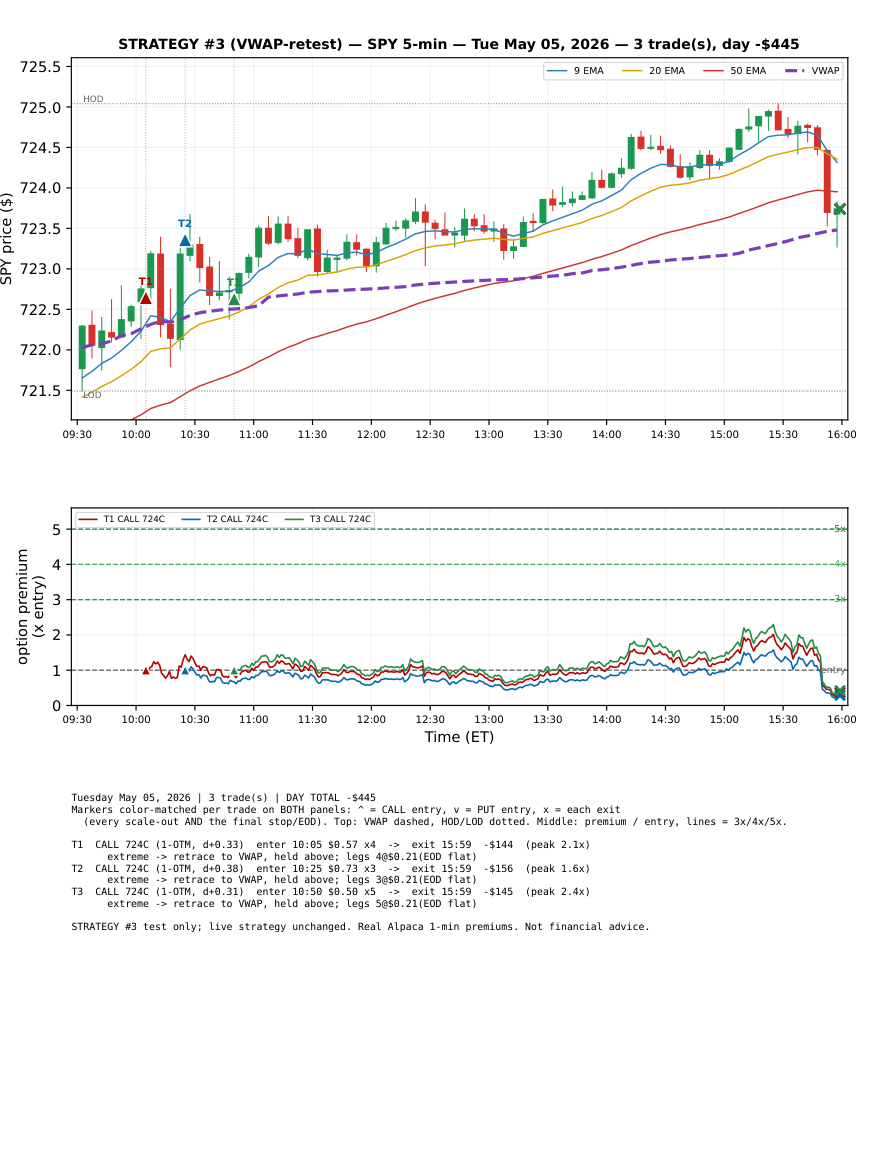
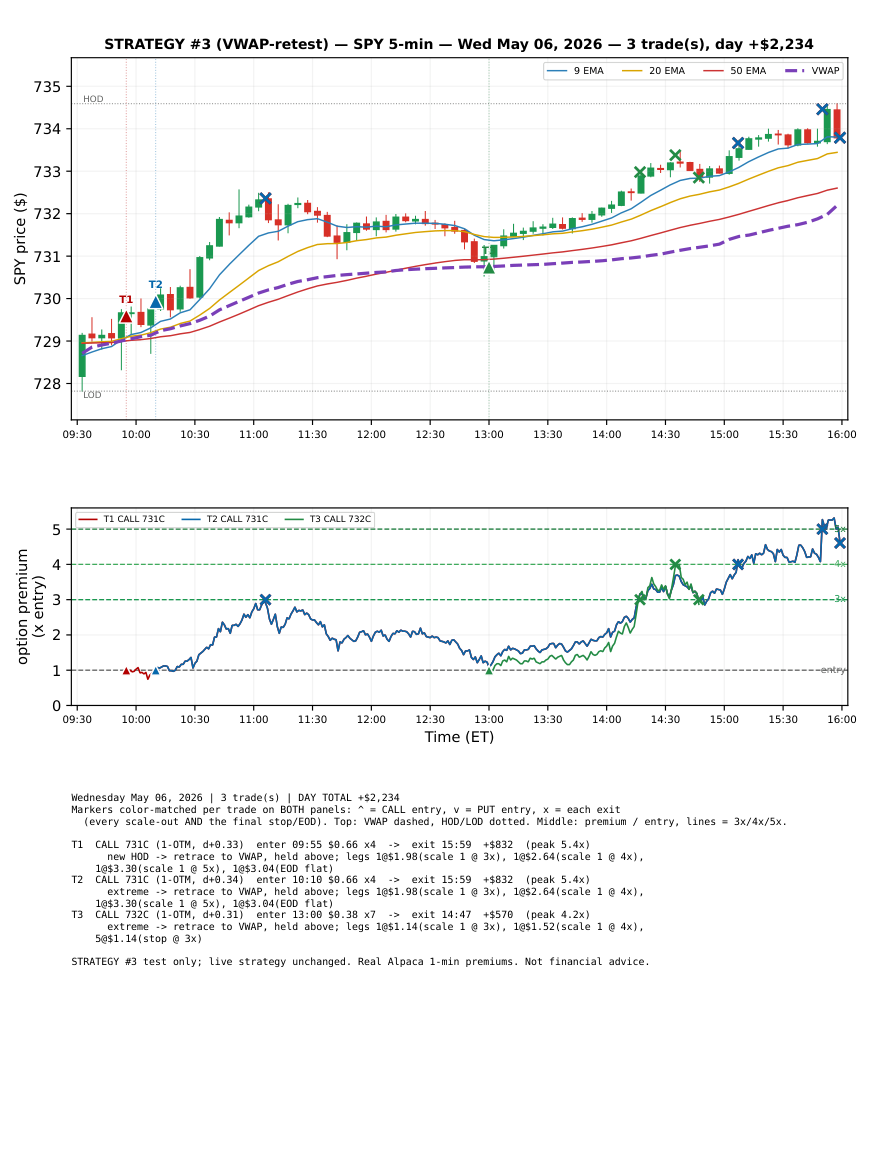
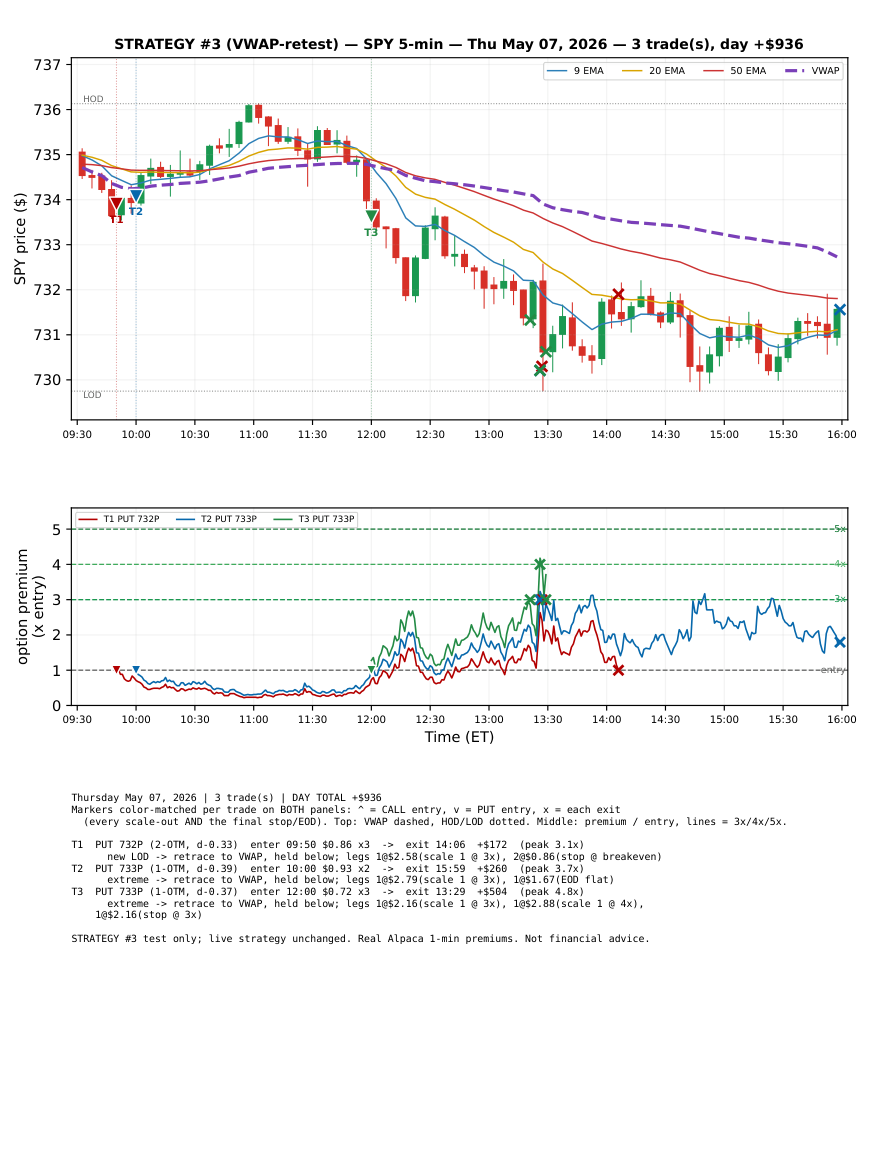
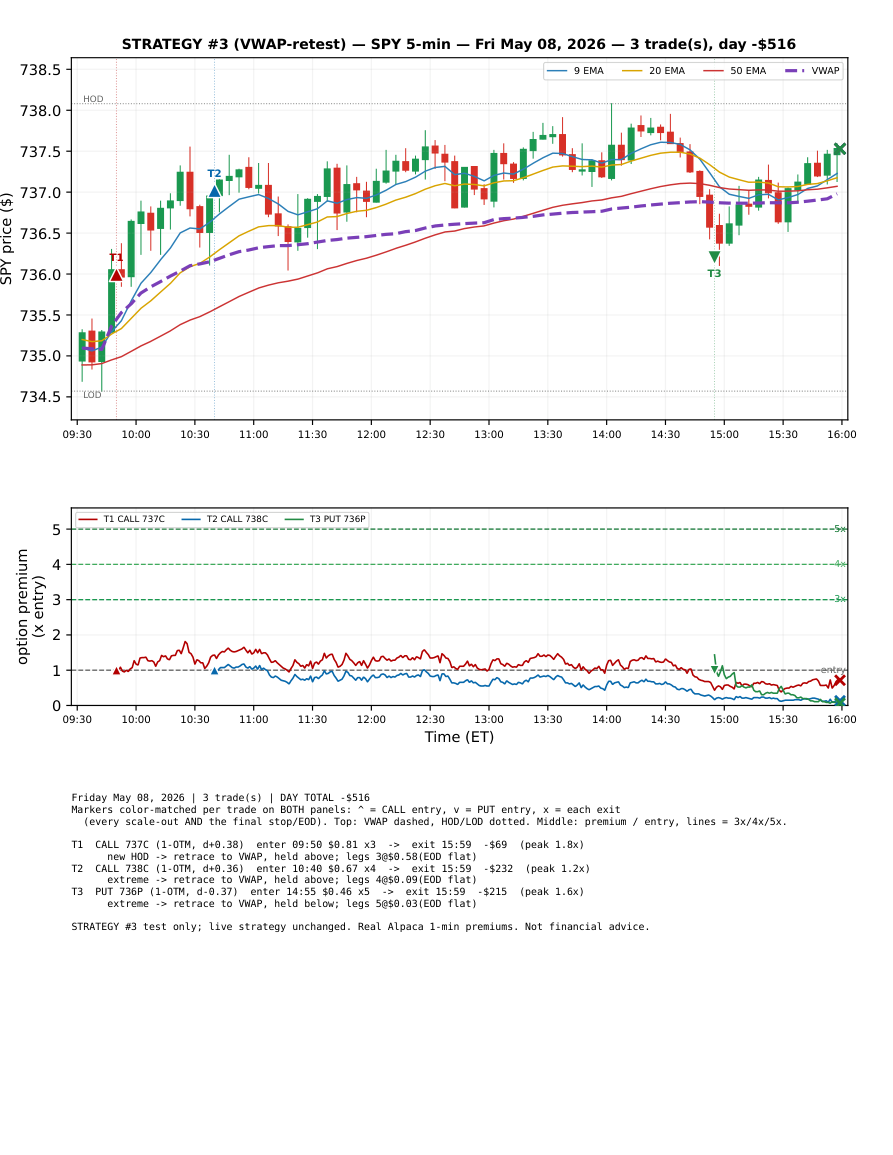
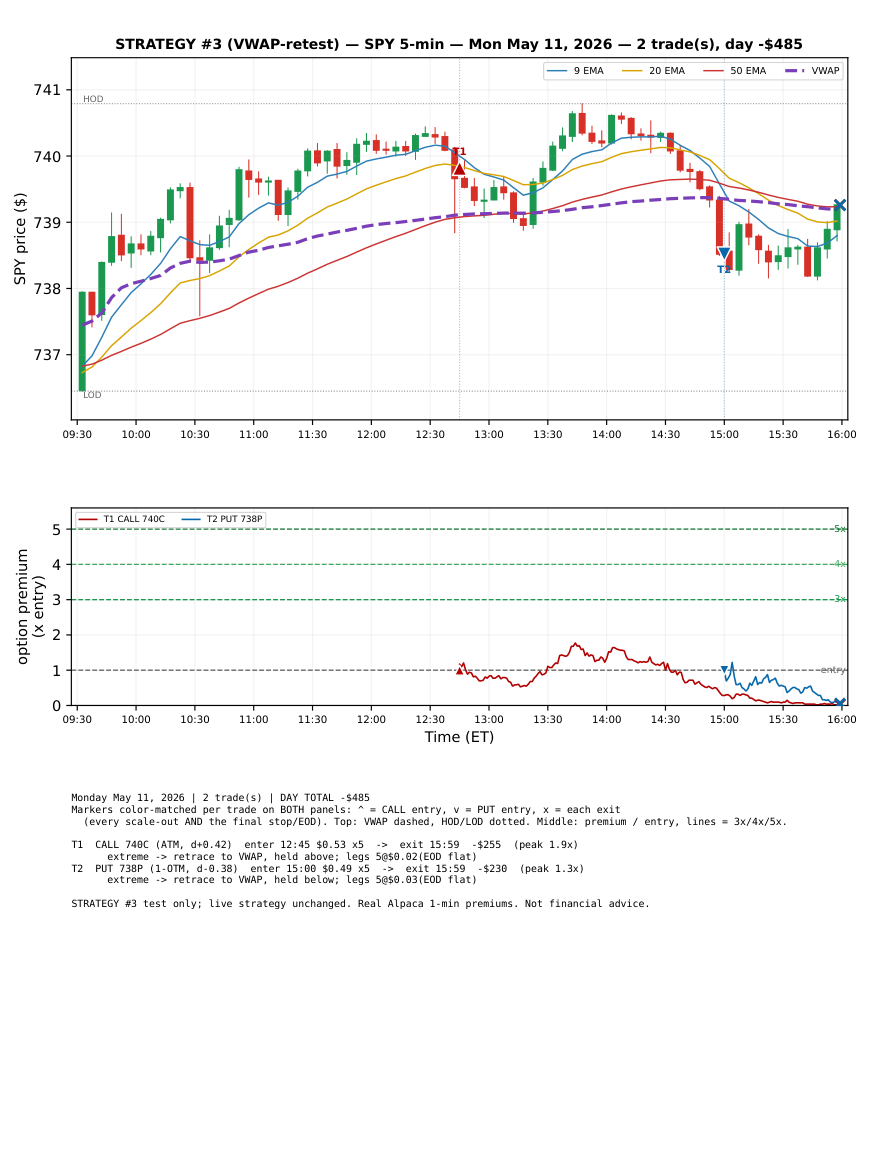
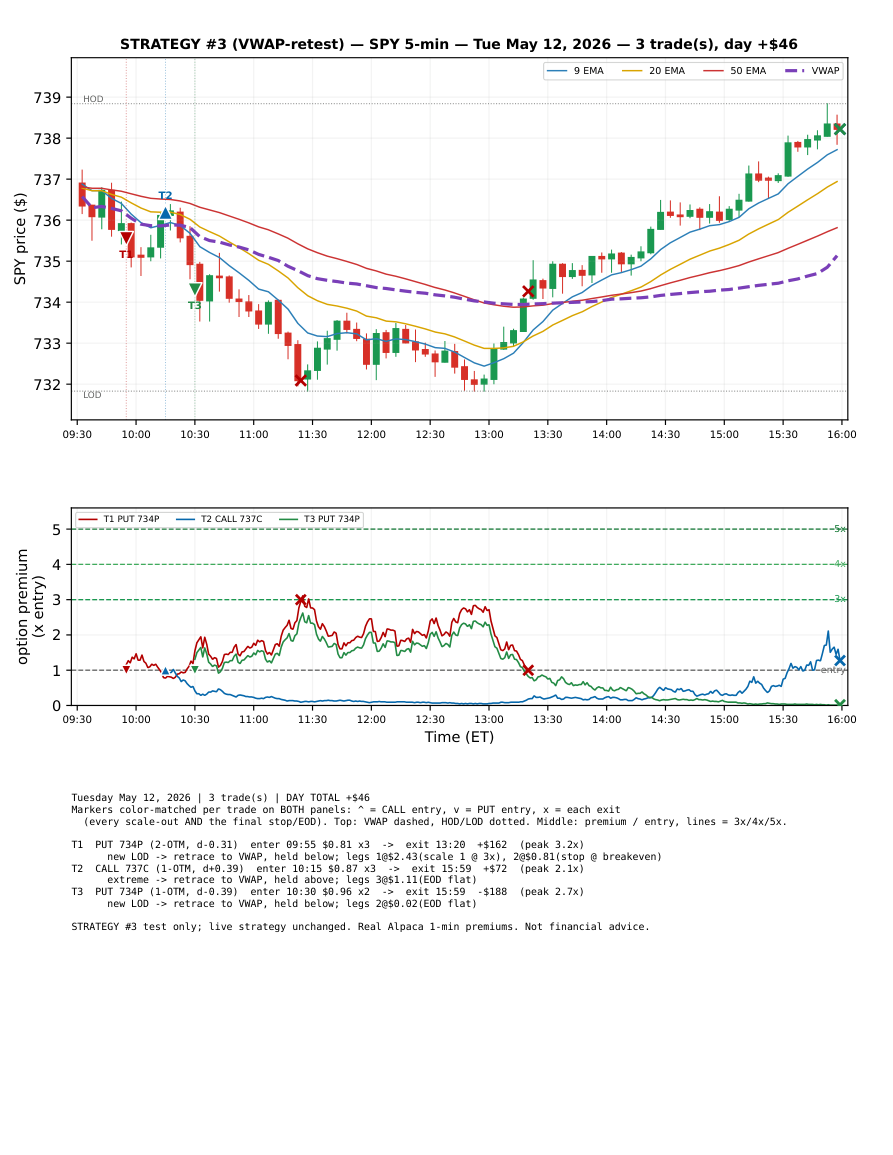
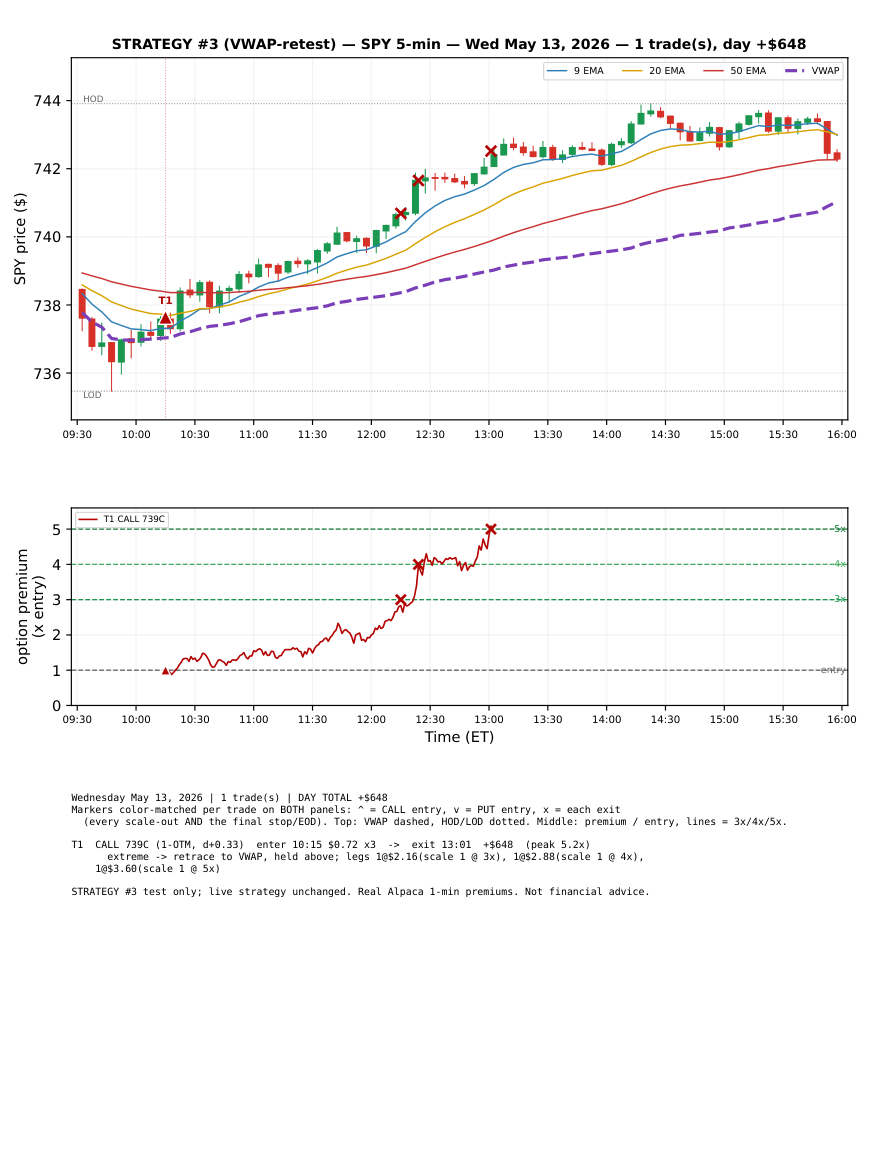
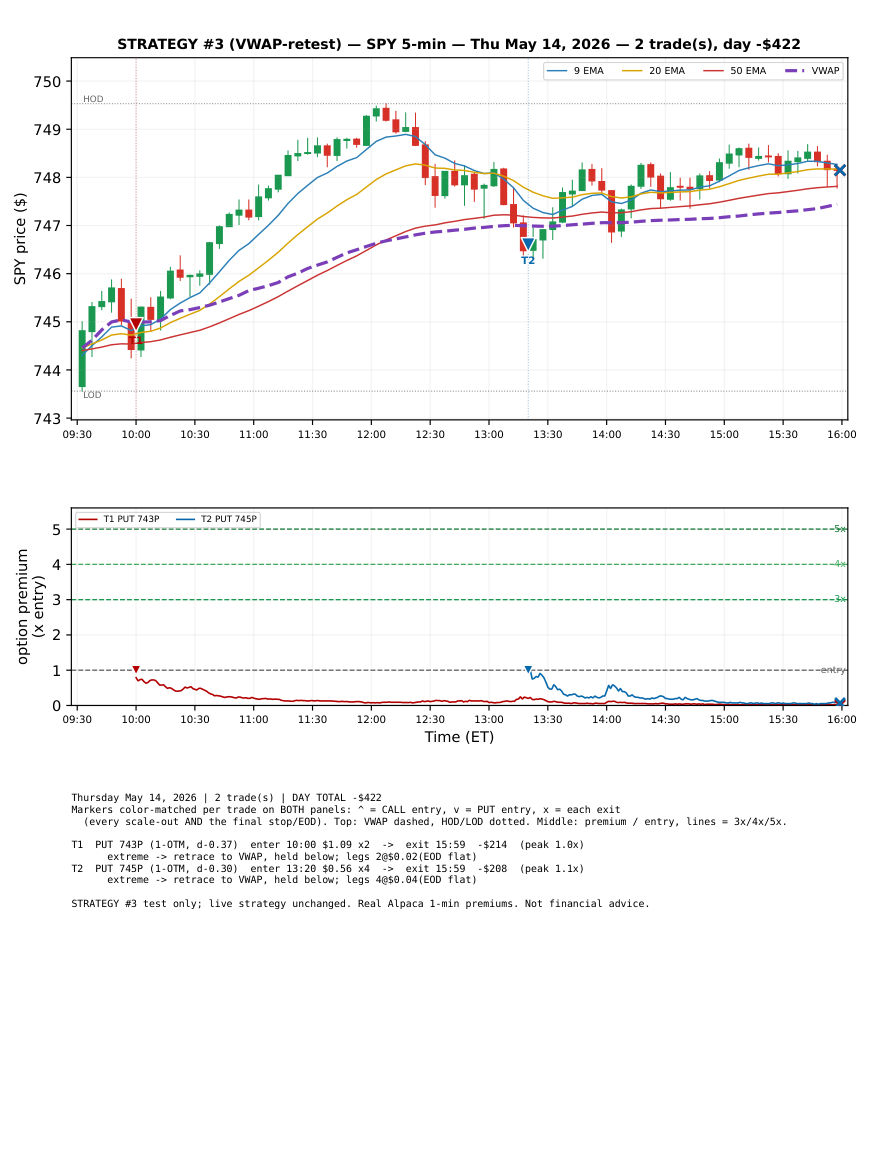
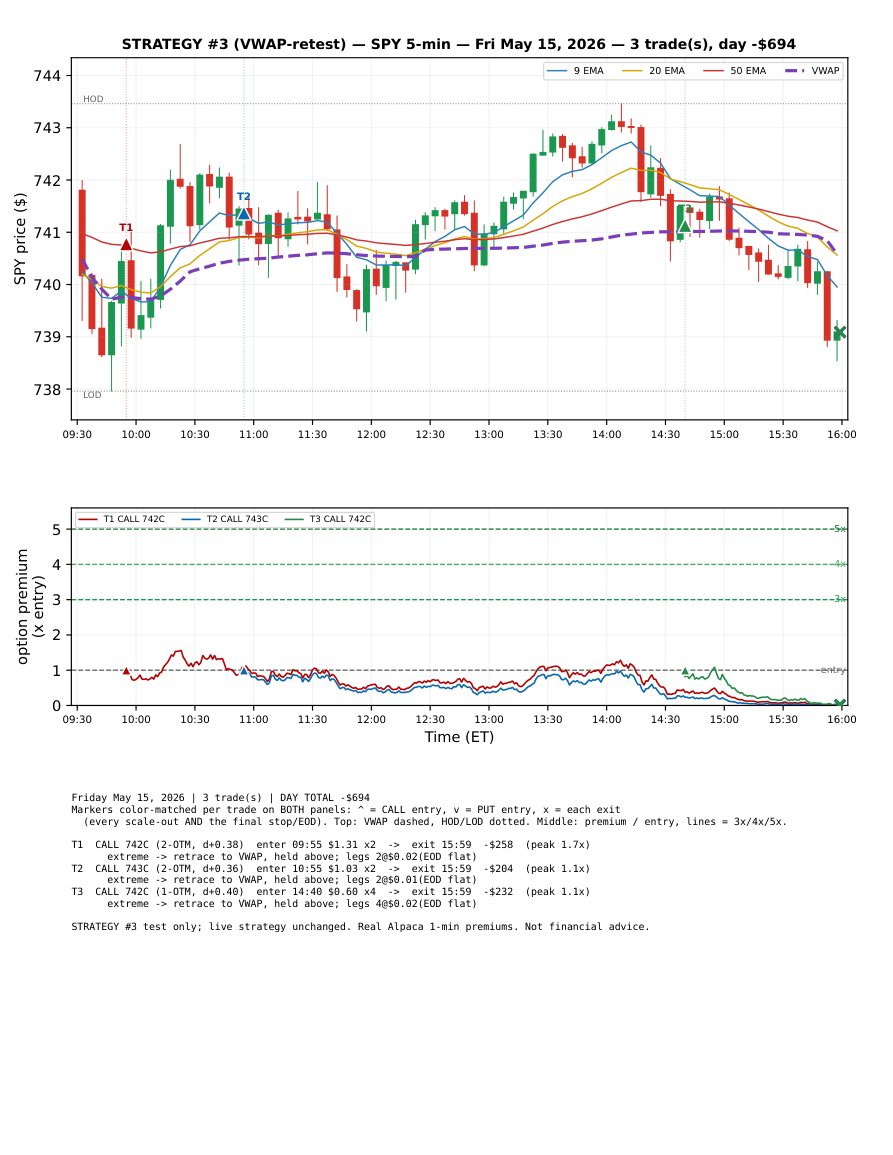
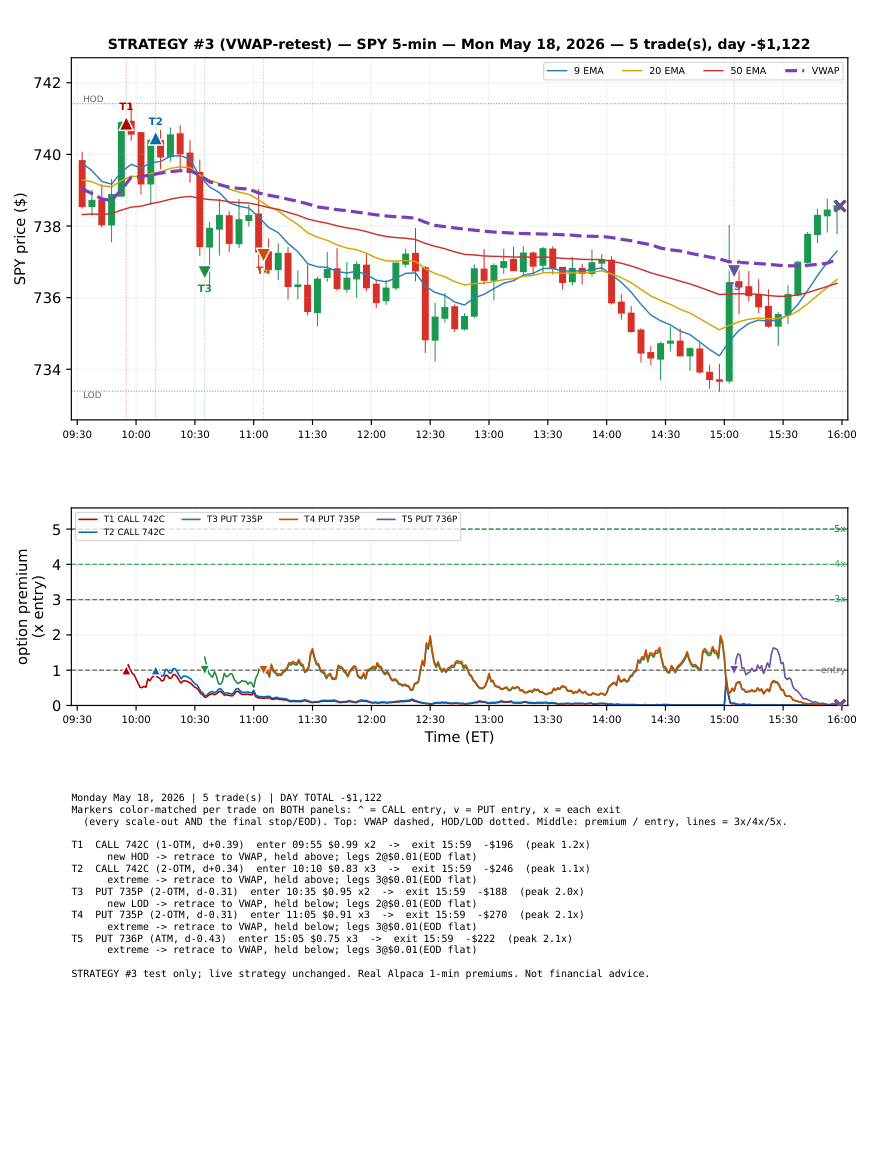
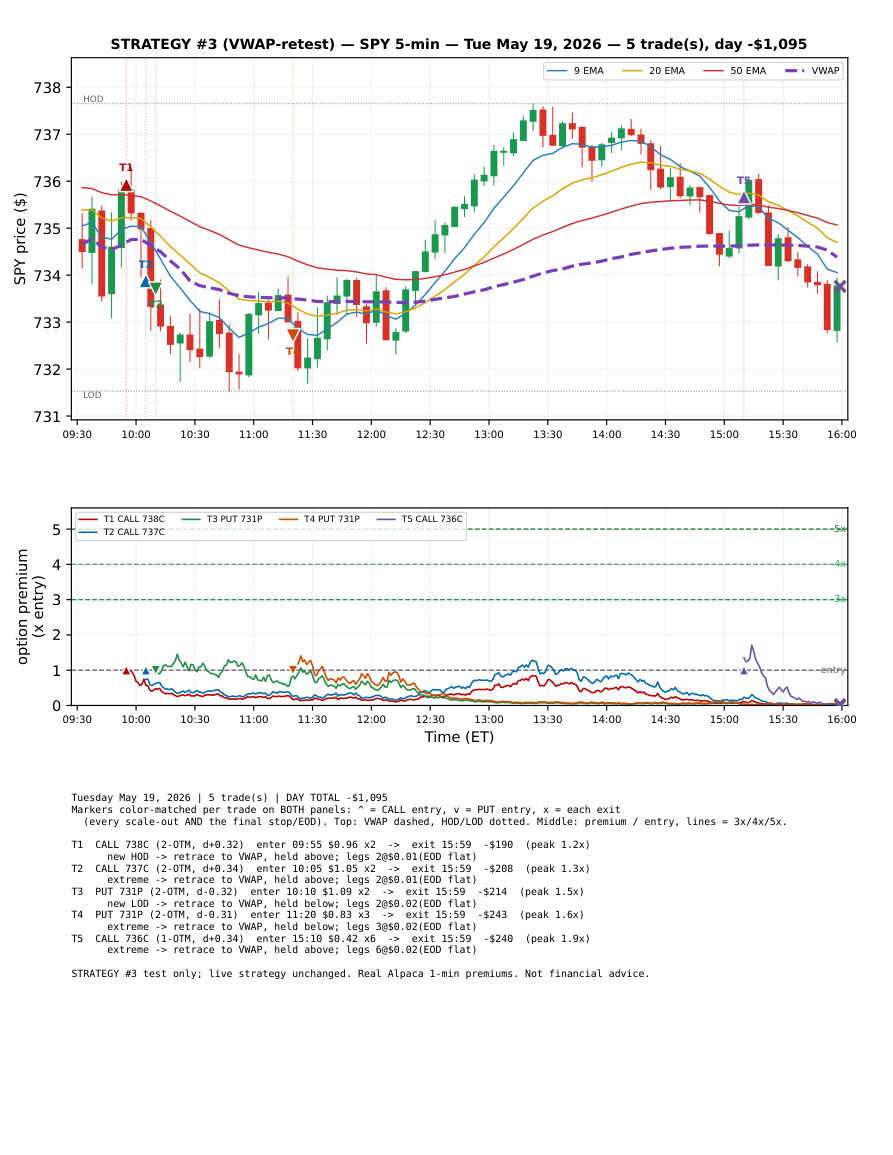
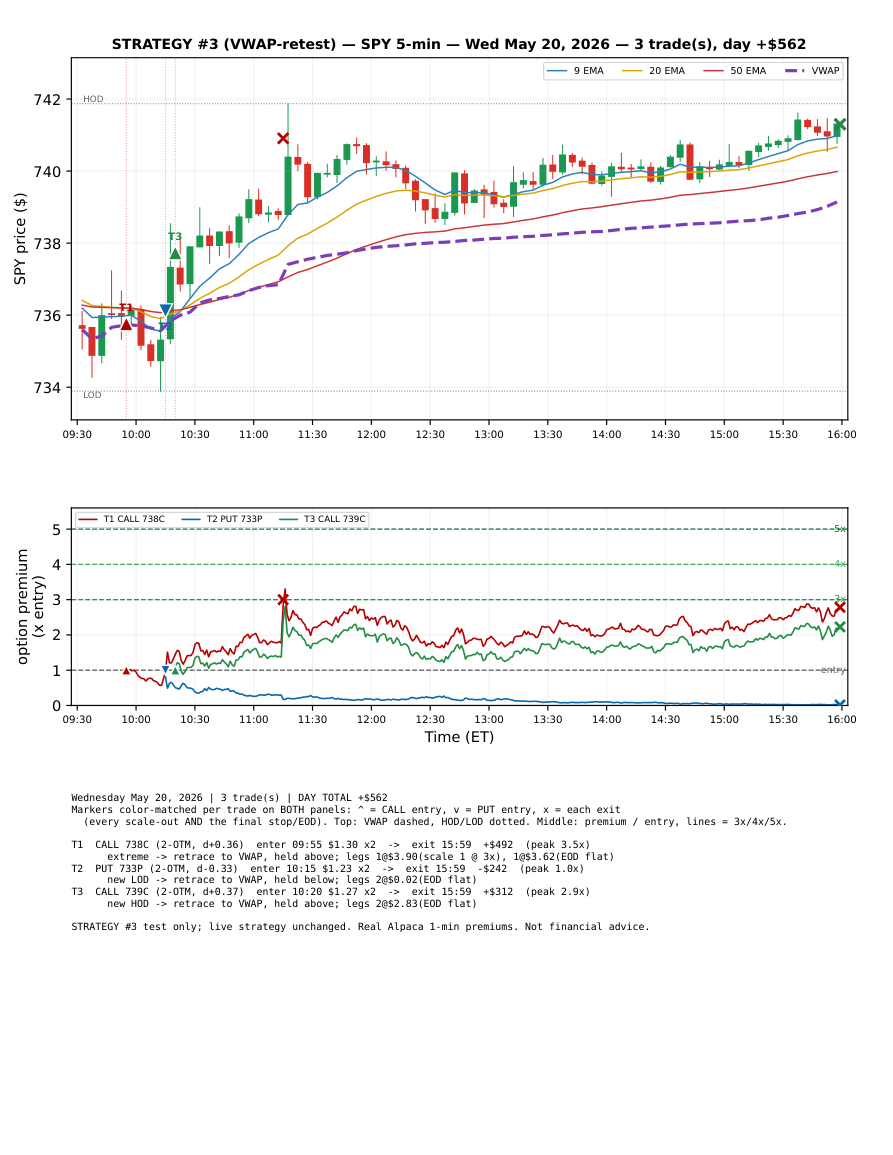
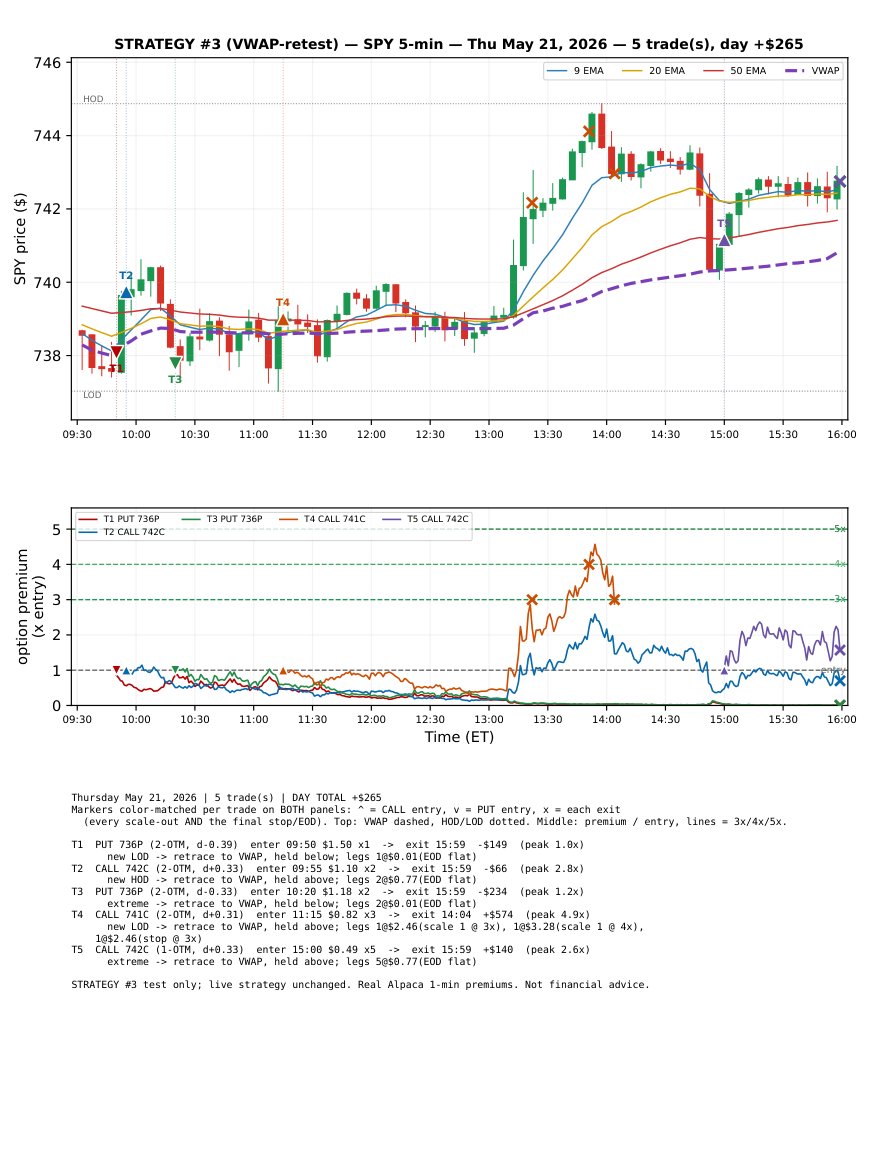
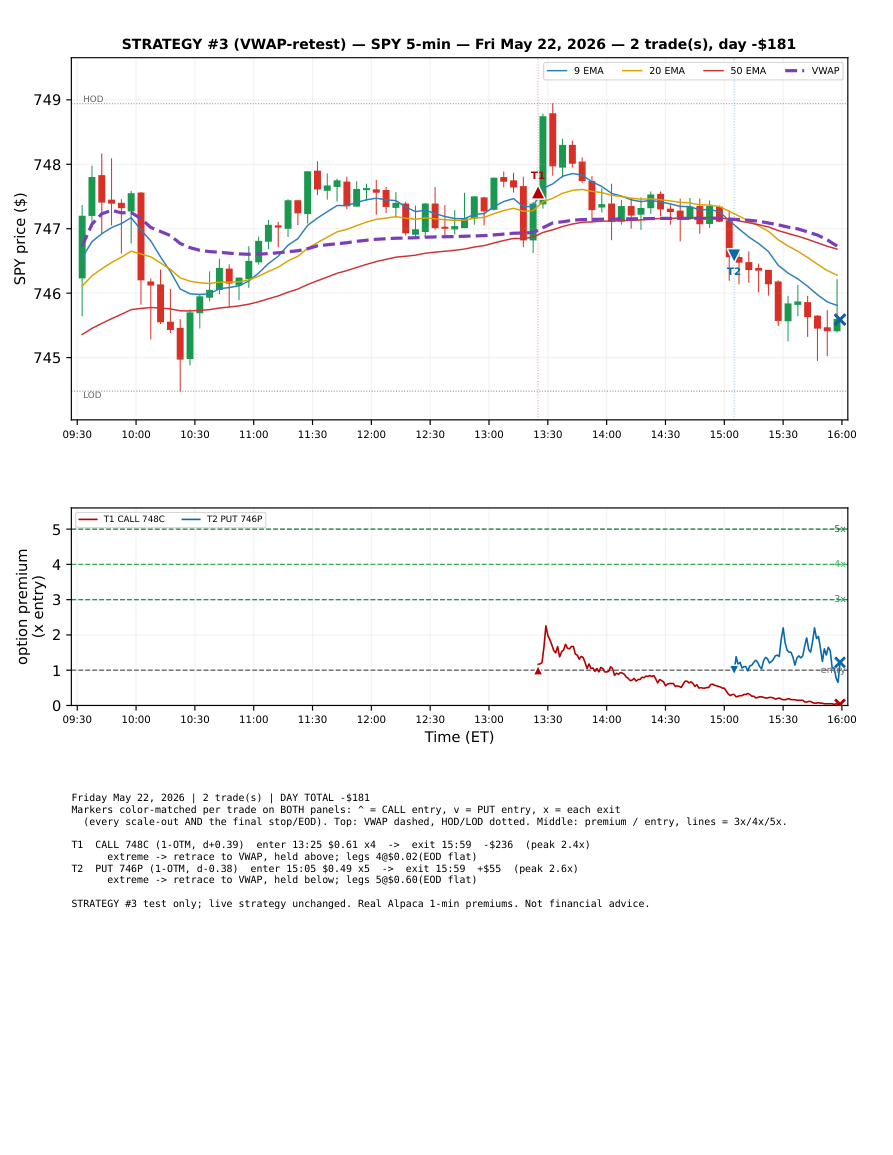
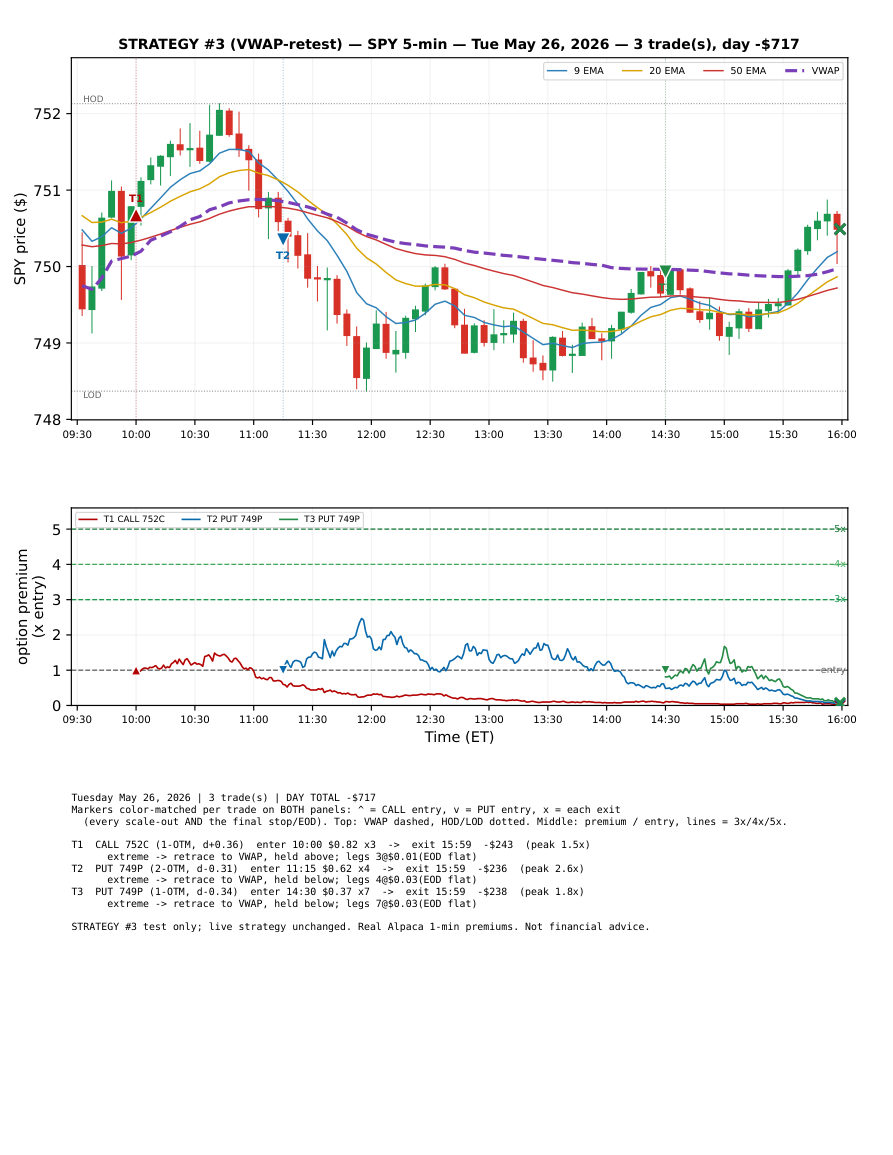
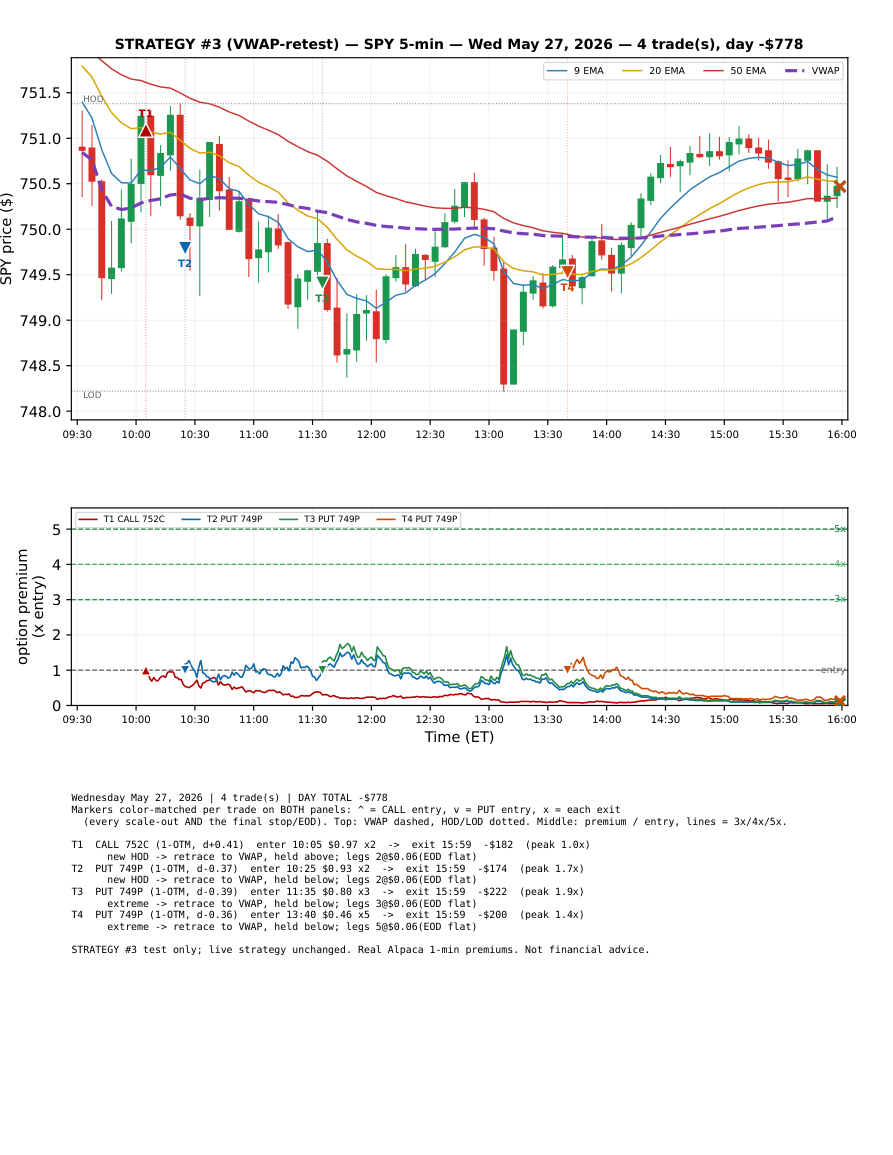
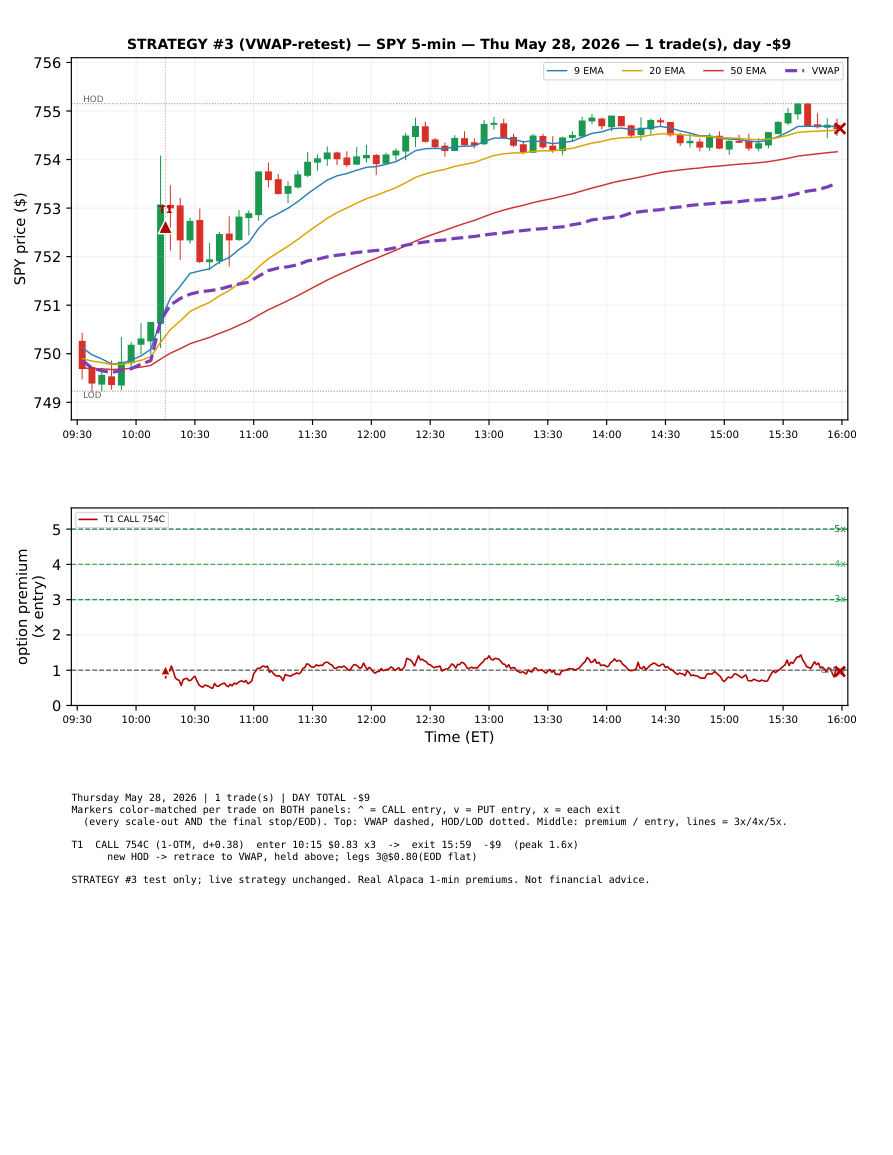
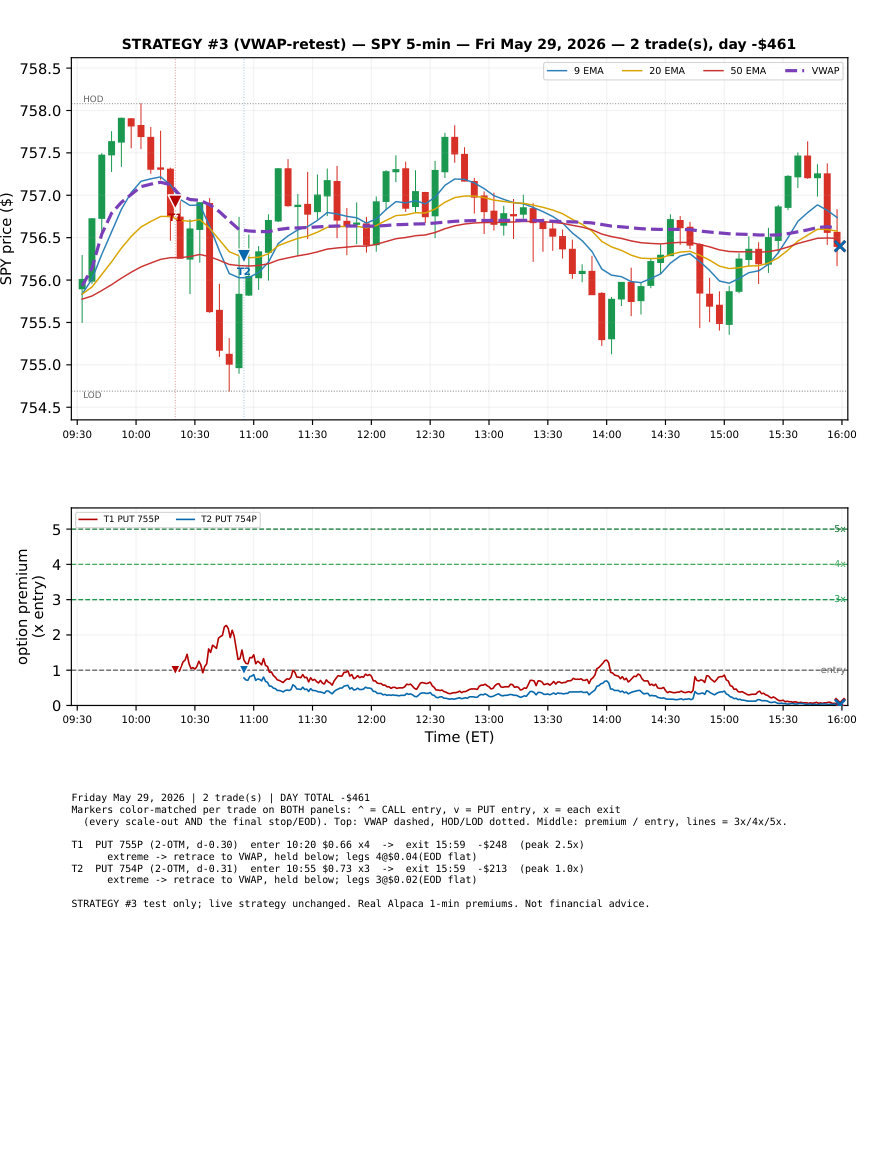
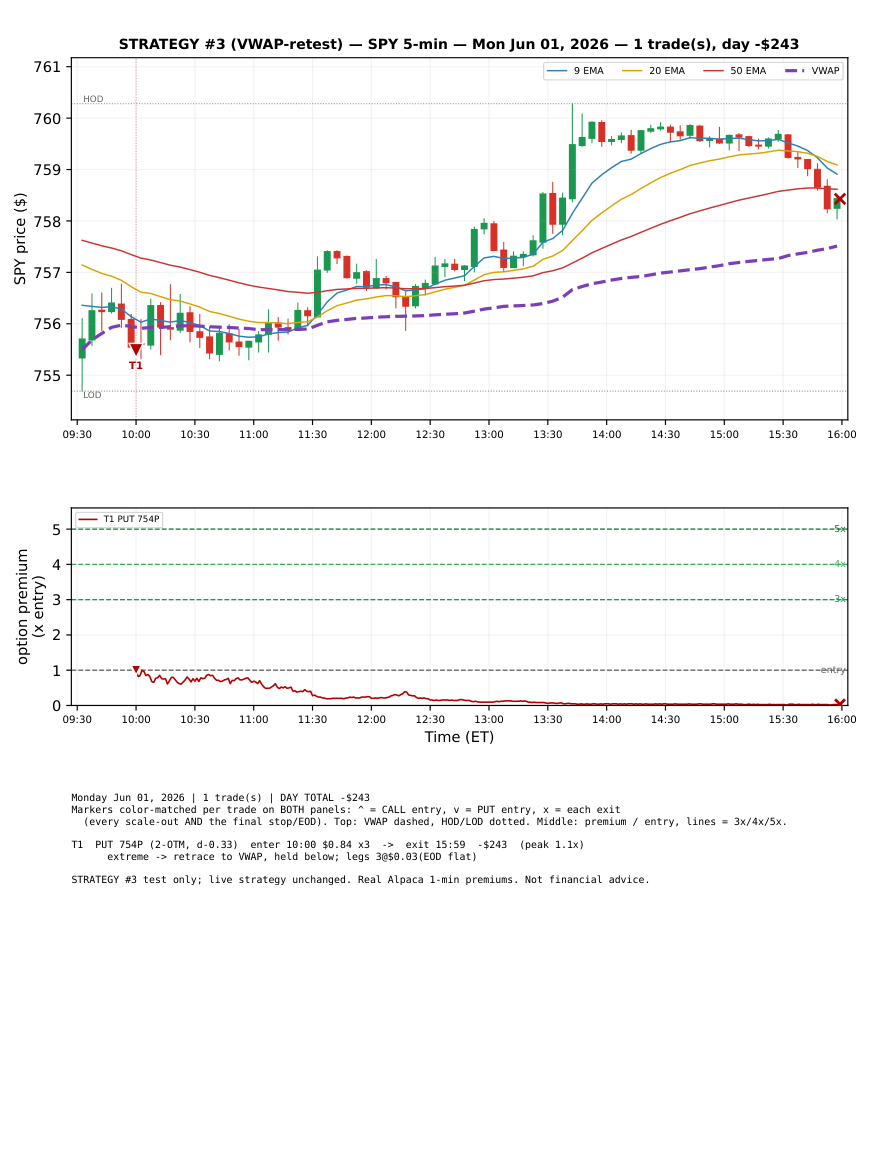
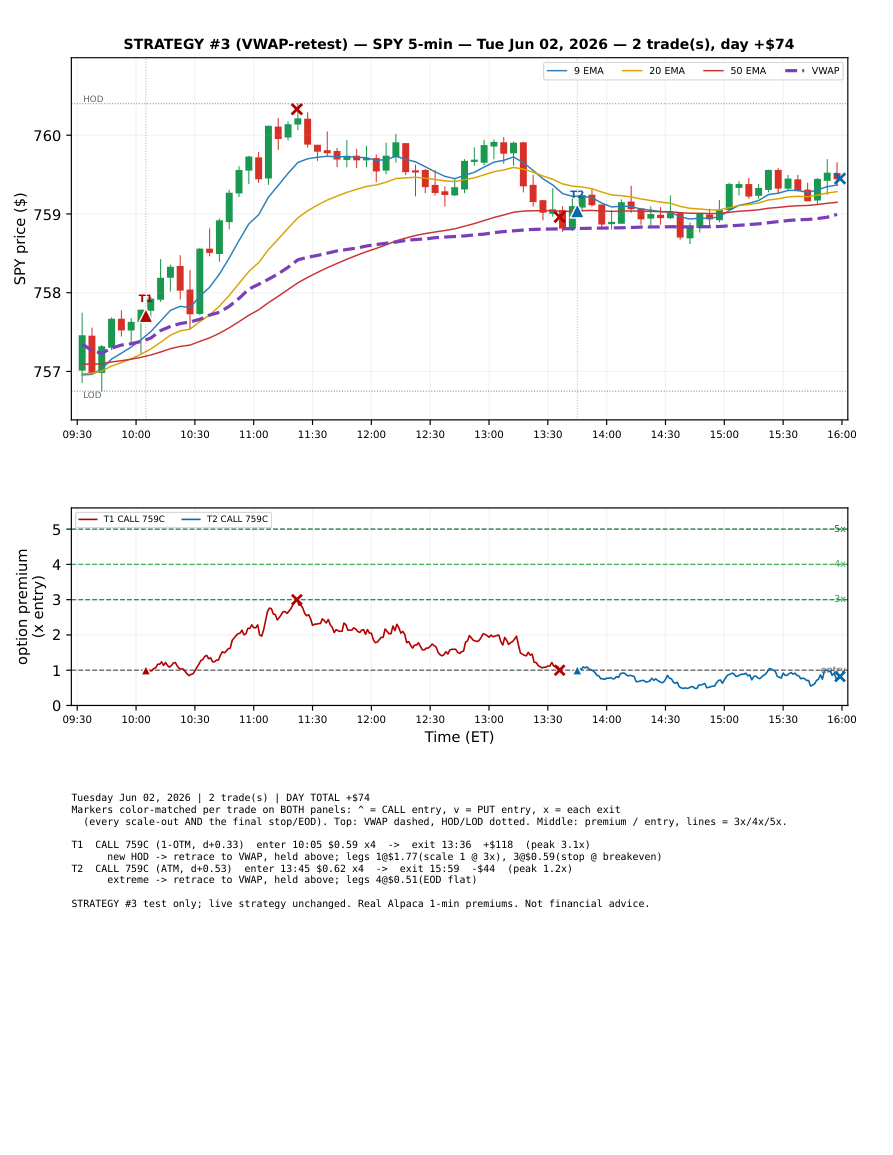
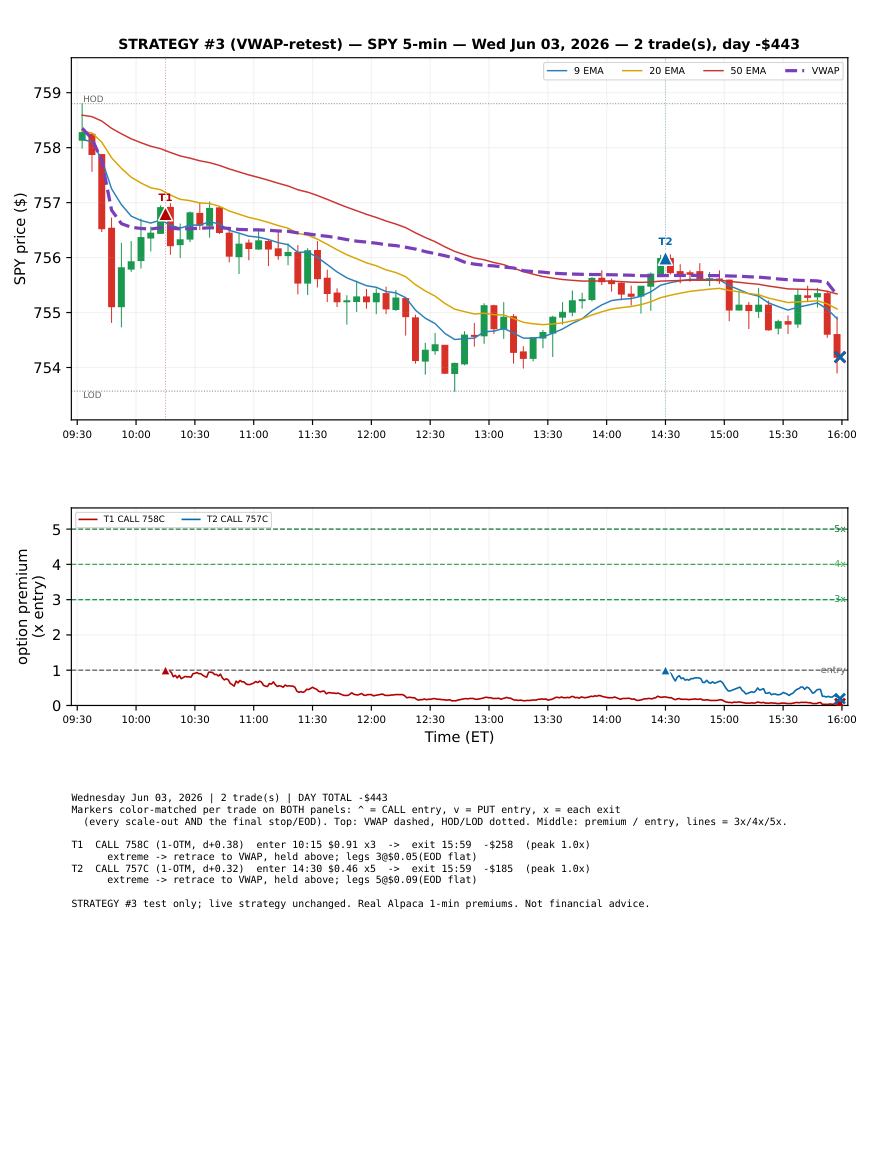
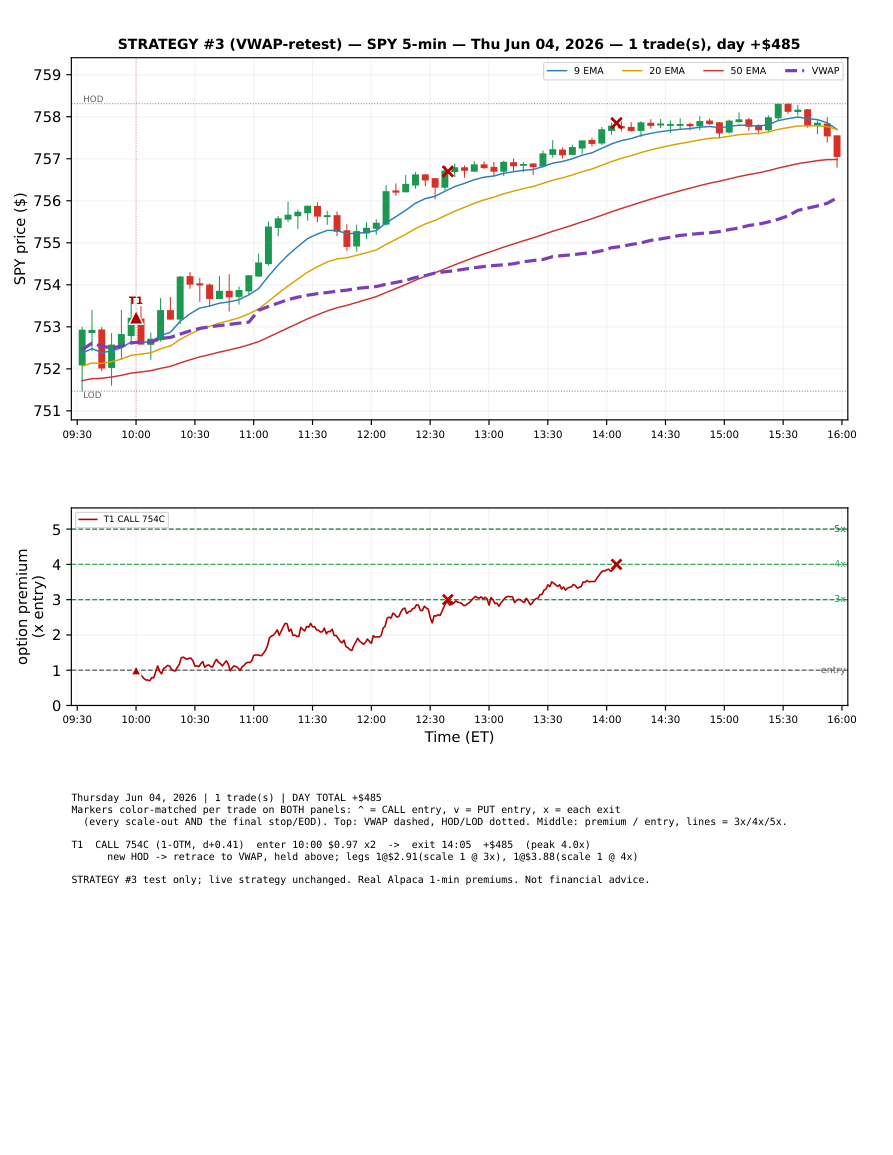
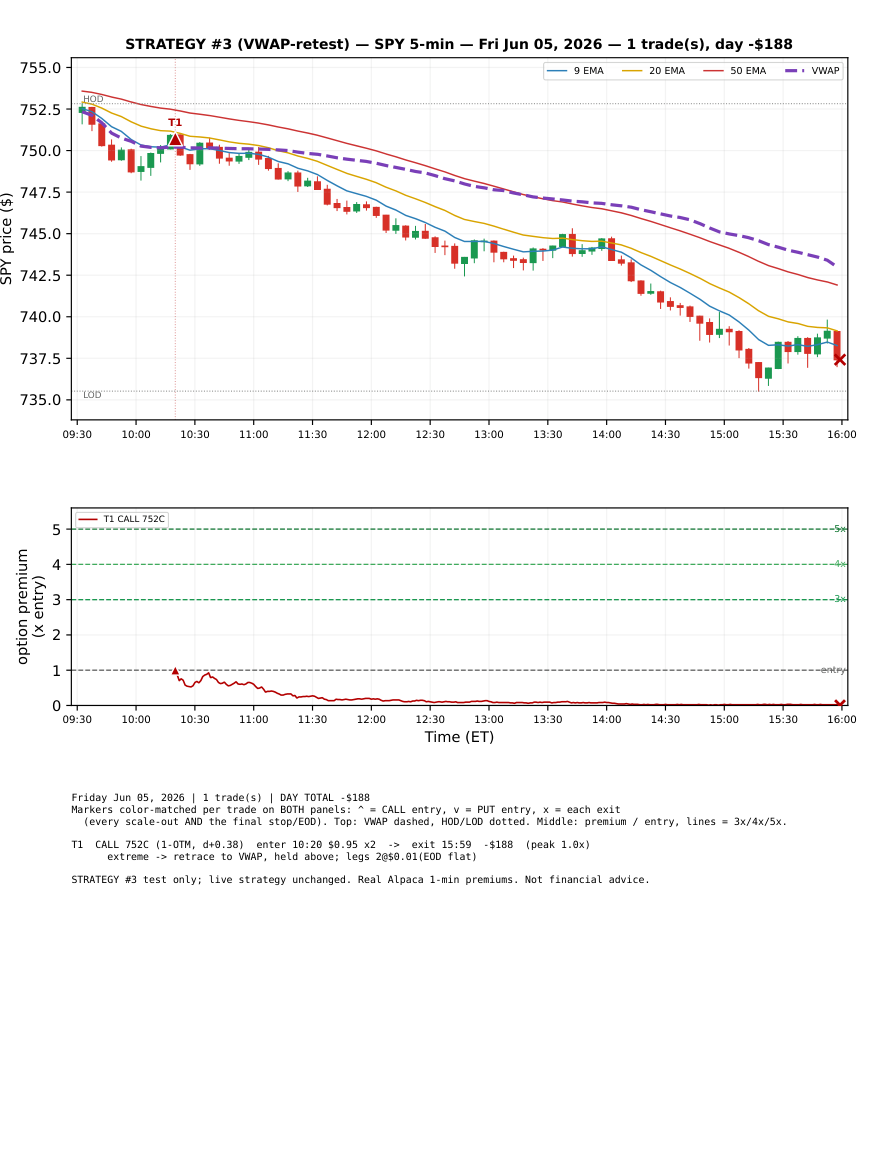
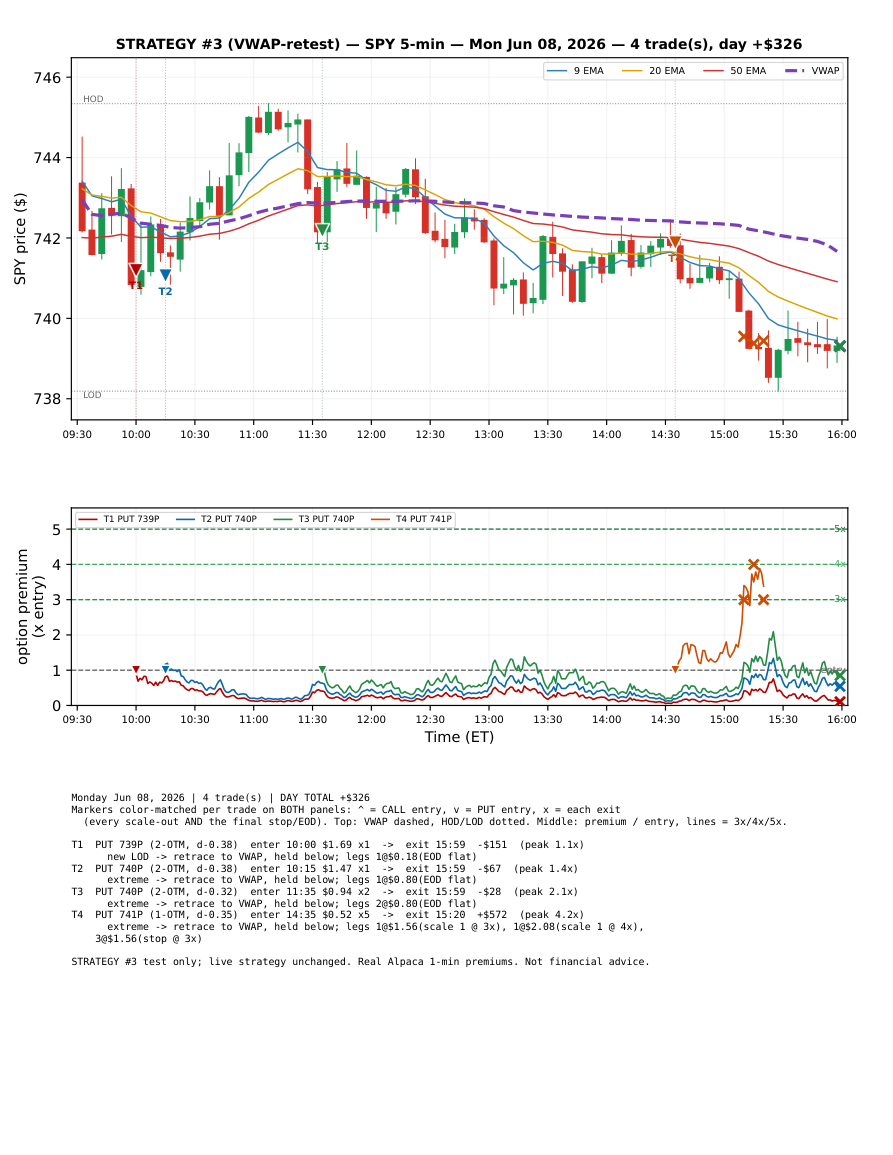
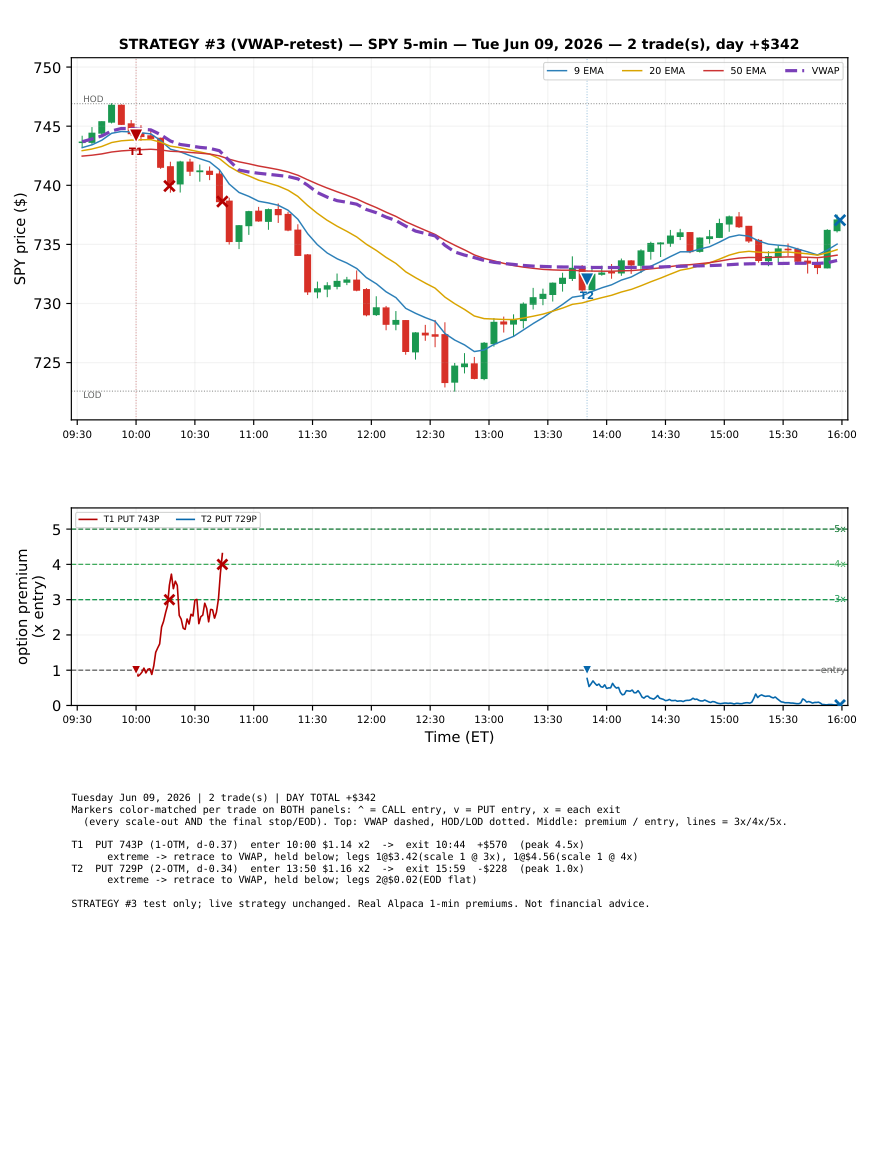
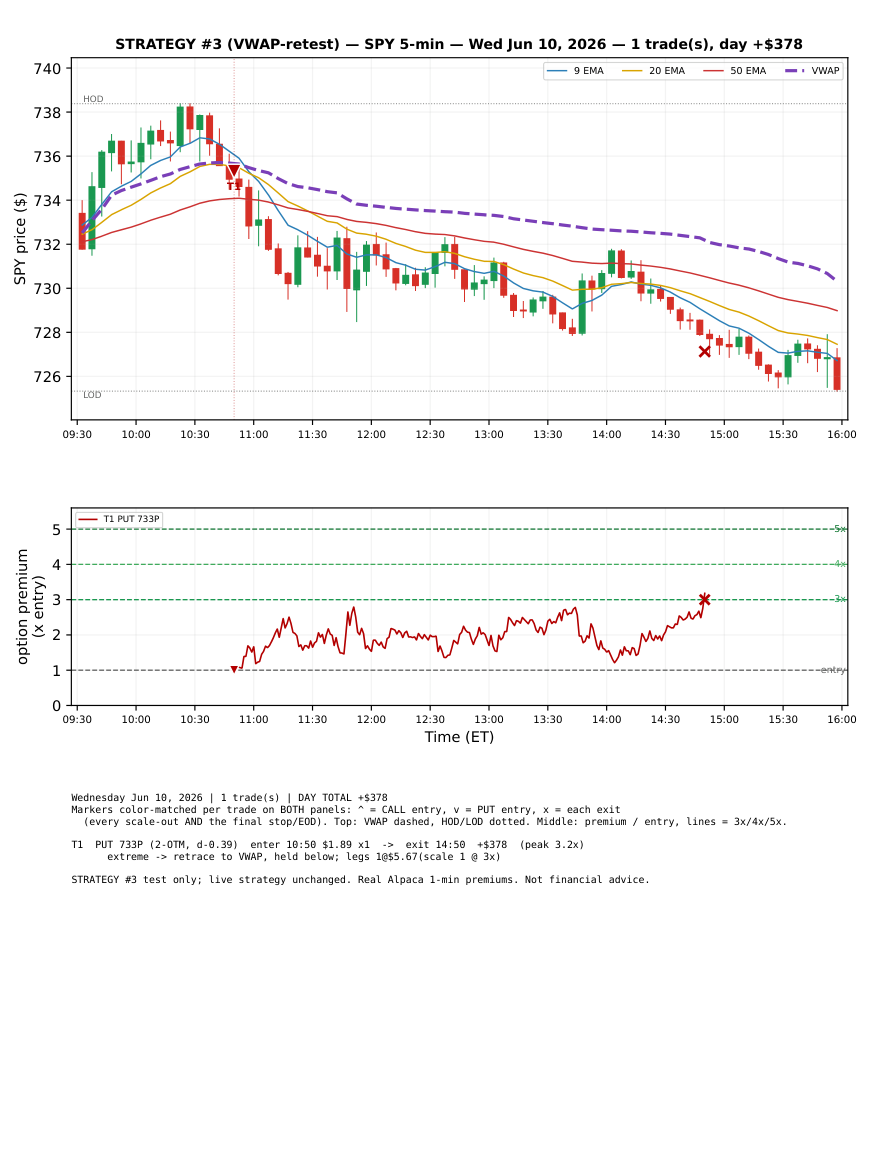
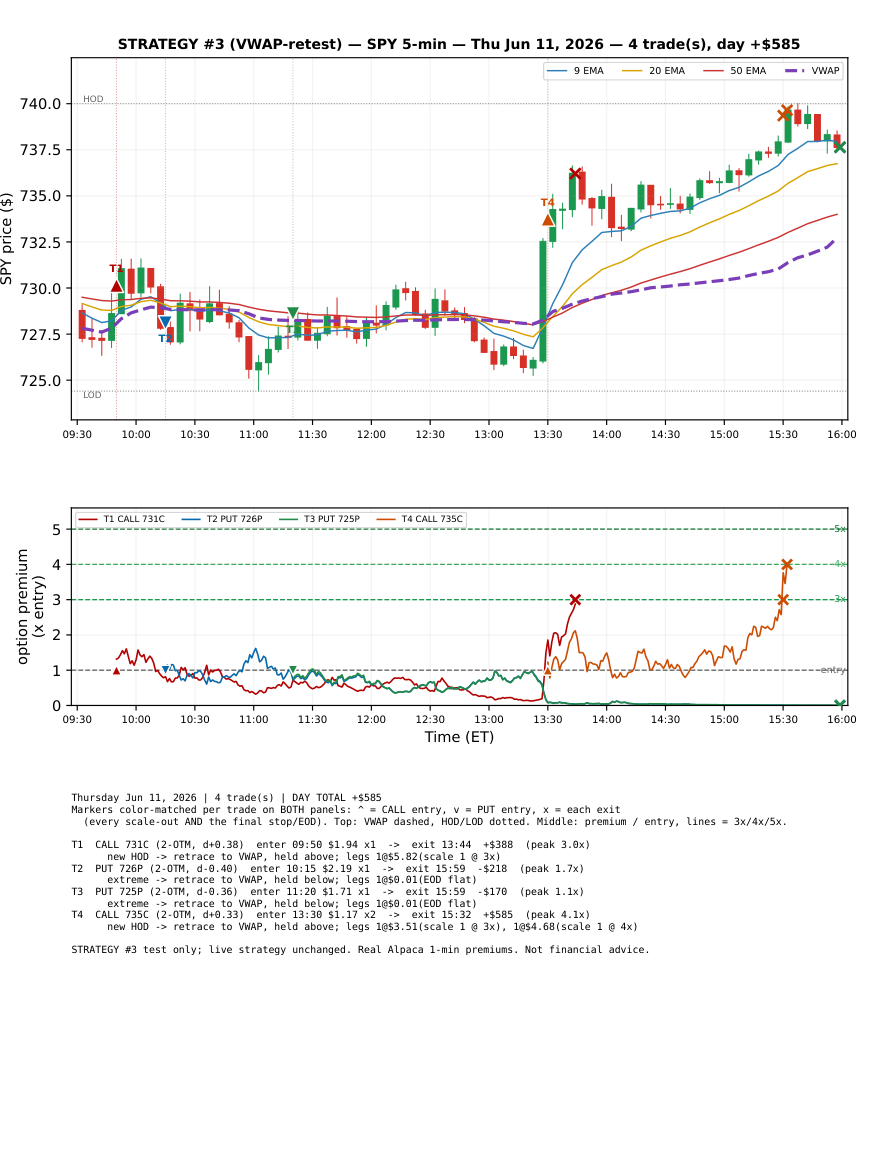
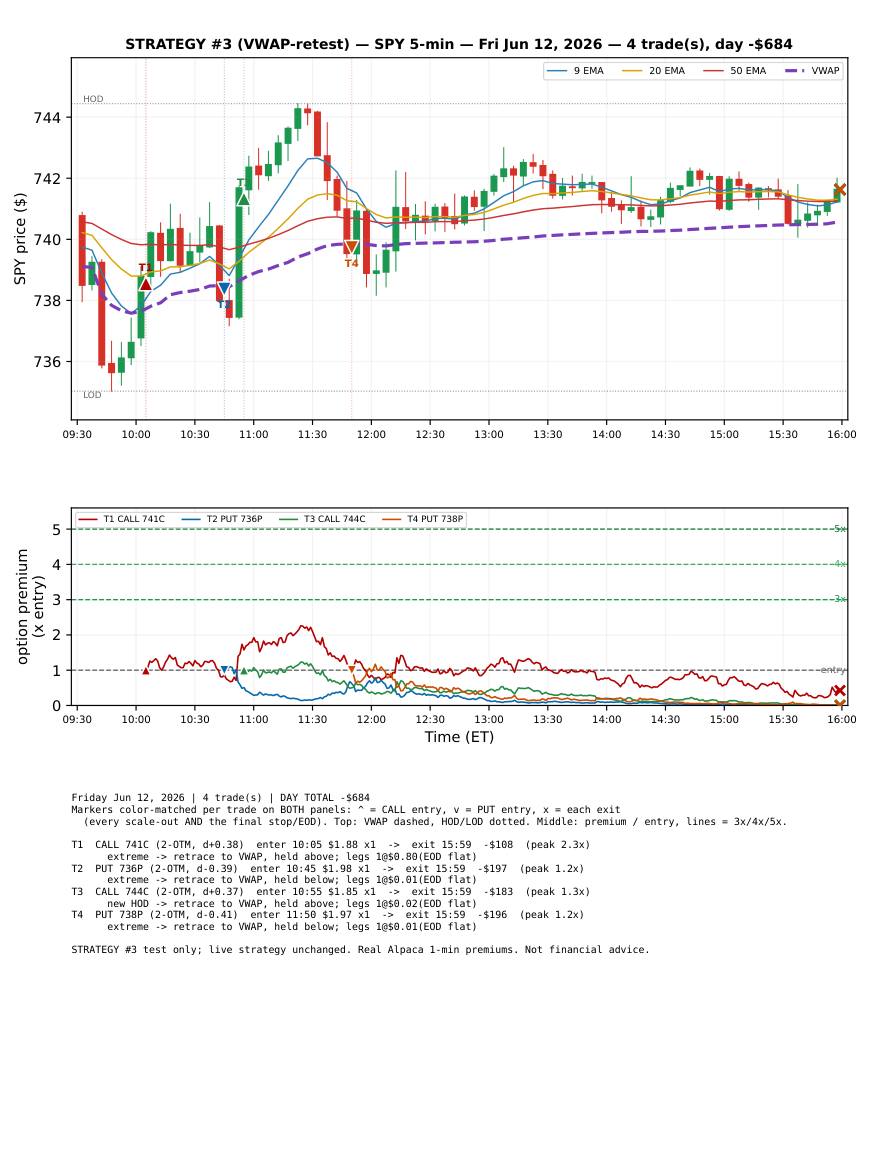
After each new HOD/LOD, retrace to VWAP on the 3-min chart, trade the side price holds. Strike ATM/+1/+2 OTM delta>=0.30, PfZ max-loss $275. Profit ladder: cut first 2 contracts at 2x, then 1 at 3x, 1 at 4x...; breakeven (1x) stop on runners after the first scale; 1-hour time stop; no entries after 15:00; daily loss cap $600. Real Alpaca 1-min premiums.
2x first-scale + breakeven stop1-hour time stop3-min entries$600 daily capWindow shown: May 1 – Jun 12, 2026 (in-sample, +$330 over these 30 days). Honest full picture: over 6 months (Dec 15 – Jun 12) the revised strategy is −$666 (train −$290 / test −$376) — a ~10x improvement vs the old #3 (−$8k to −$16k/yr) but still net-negative out-of-sample. The keeper remains Strategy #5 (40-DTE condor).
| Day | Trades | P/L |
|---|---|---|
| Fri May 01 | 2 | +$24 |
| Mon May 04 | 3 | -$44 |
| Tue May 05 | 4 | +$50 |
| Wed May 06 | 2 | +$499 |
| Thu May 07 | 3 | +$12 |
| Fri May 08 | 2 | +$125 |
| Mon May 11 | 2 | +$63 |
| Tue May 12 | 3 | -$45 |
| Wed May 13 | 1 | -$146 |
| Thu May 14 | 2 | -$15 |
| Fri May 15 | 3 | -$317 |
| Mon May 18 | 3 | +$128 |
| Tue May 19 | 3 | -$282 |
| Wed May 20 | 2 | +$418 |
| Thu May 21 | 4 | -$207 |
| Fri May 22 | 2 | -$160 |
| Tue May 26 | 2 | +$281 |
| Wed May 27 | 4 | -$267 |
| Thu May 28 | 1 | -$51 |
| Fri May 29 | 2 | +$39 |
| Mon Jun 01 | 2 | +$46 |
| Tue Jun 02 | 1 | -$132 |
| Wed Jun 03 | 2 | -$194 |
| Thu Jun 04 | 1 | +$266 |
| Fri Jun 05 | 1 | +$4 |
| Mon Jun 08 | 2 | -$56 |
| Tue Jun 09 | 2 | +$2 |
| Wed Jun 10 | 1 | +$202 |
| Thu Jun 11 | 4 | +$27 |
| Fri Jun 12 | 3 | +$60 |
| 30-day total — May +$105 / June +$225; 69 trades, 30 winners (43%), 17/30 green days | +$330 |
Revised exits (2x first-scale, breakeven stop, 1-hr cut, 3-min, $600 cap) cut the old #3's bleed ~10x; full 6-month result -$666 (still net-negative OOS). These 30 days are an in-sample sample, not the verdict.
Strategy #3 test only; live strategy unchanged. Not financial advice.